3-point health check for the success of your business

When you look at your finances, what you really want to know is – ‘how are we doing?’  It is quite easy to drown in numbers and not see the stories the numbers are trying to tell us.   After all, a number is only useful if helps you make business decisions.


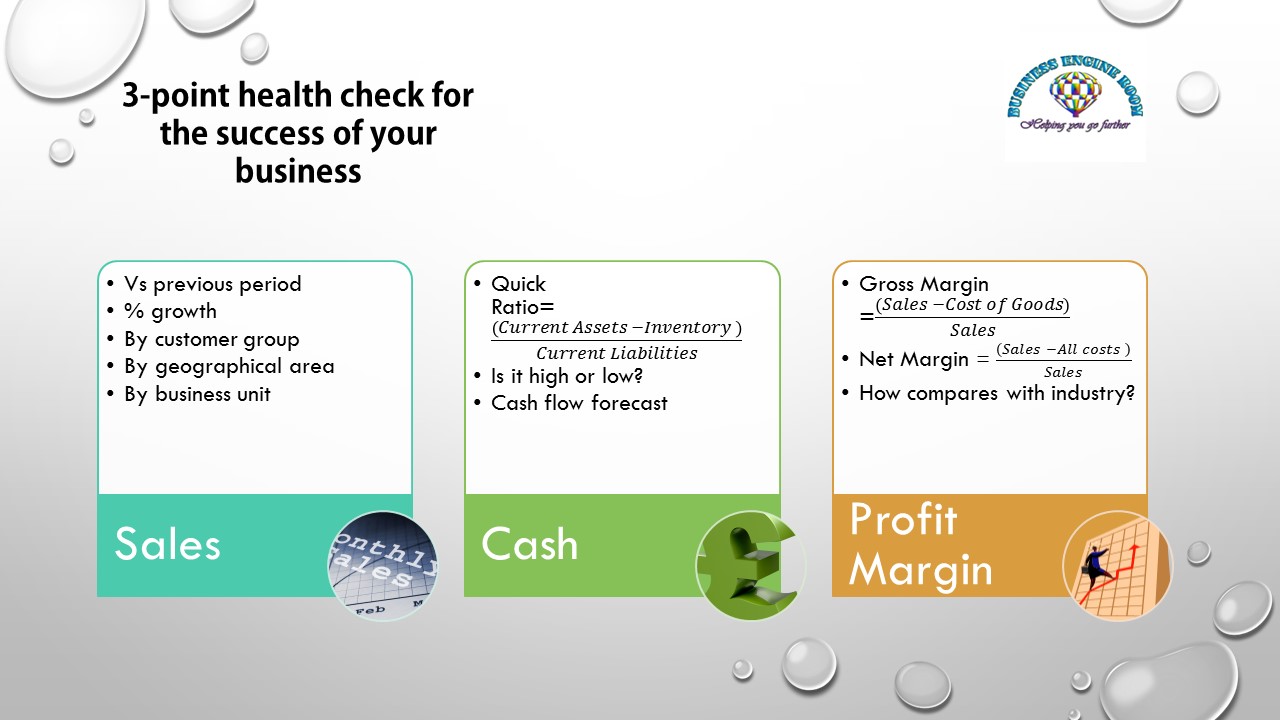
For profit-making companies, here is a 3-point checklist to assess the financial health of your business and understand the stories the numbers are telling.


  1. SALES


Not rocket science!  Sales tends to be the first thing a business owner looks at.  How do sales compare with the last month/quarter/year?  Are we growing?  More interesting analysis is around what makes sales grow (or not) – is it volume, price increases, or a combination of the two?  It may be useful to break sales down into geographic areas or customer groups, to see how performance varies.  It may well be that underneath an average sales performance overall, there are successes in some areas and failures in others.  Once you understand what these areas are, there are some decisions to be made.


  1. PROFIT MARGIN


There are two numbers to explore:


Gross Margin or Contribution is your sales minus the cost of goods, or sales minus variable costs (i.e. not overheads) for service businesses.  This figure will tell you how much money you make on your basic business activity and whether it is worth your while.  It is useful to compare your gross margin as a percentage to the prevalent margin in your industry.  If you are making 20% of sales in gross margin, while your industry peers are managing 40%, perhaps you need to examine your costs.  If you have several product lines, look at the contribution of each of the product lines – are they all performing well?  Do they cross-subsidise each other?  Unless the product which is losing you money is a loss leader you have consciously committed to, you may want to review your product offering or product mix.


Net profit margin – in simple terms, it’s your profit after all costs have been deducted; in percentage terms, it’s your net profit figure over sales.  A positive profit figure is, obviously, desirable, as it indicates that you have covered all your costs and made some money.  Taking a step further, is your net profit margin reflective of your industry?  Does it represent a reasonable return on investment? (to find out the latter, take net profit and divide it by your capital employed, i.e. equity plus long-term debt)  If your gross margin is ok but your net profit margin is too low, it is time to examine your overheads and/or create a strategy to grow your sales.


  1. CASH


Cash is crucial for small and medium-sized businesses.  Even if the business is profitable, lack of cash can quickly lead to problems.


Quick ratio – this ratio is your current assets (cash or what can easily be converted into cash, but NOT inventory and NOT fixed assets) over your current liabilities (current means due within a year).  This ratio helps you assess whether you have enough ‘liquid’ assets to cover your debts.  While the exact figure varies by industry, 2 to 2.5 is a good rule of thumb for most businesses.  If your quick ratio is low, beware of potential cash flow problems.  If it is too high, consider investing excess cash into longer-term investments to maximise your income.


Cash flow forecast – while this isn’t exactly a ‘figure’, forecasting your cash flow is crucial for businesses which are growing, or businesses which are in a downturn.   It is a planning tool, which can prompt a number of actions to remedy the cash position.  You may find that you need to chase your debtors more actively or negotiate with your suppliers for longer periods of payments.  You may also find that you need short-term finance to support your rapid growth.


3 focus areas for Business Success

Financing Your Business Growth

It is a well-established truth that businesses live or die based on their cash flows.  If you intend for your business to grow, you will most certainly need more cash than what is required for maintaining a steady turnover.  You might be asking two questions: 1) How much will I need? and 2) Where will I get it?

How much will I need?

In any business, cash is typically tied up in the short term in things like stock (be it raw materials or goods ready for re-sale) and debtors, i.e. customers who owe you money.  On the other hand, your business will probably take advantage of your supplier’s credit terms, which gives you some cash in the bank for the duration of the credit terms.  However, this cash is not usually enough to finance your operation while you are waiting for the inventory to become sold goods and for your customers to pay their debts.  This shortage of cash is known as working capital requirement.  It is useful to look at the working capital requirement as a percentage of sales.  For example,

Current Assets                                             £250,000

Current Liabilities                                        £150,000

Working Capital Requirement                     £100,000

Sales                                                              £500,000

% of sales                                                       20%


What this means is that for every pound of sales, £0.20 will be required to fund the working capital.   If your business wants to grow its sales, you can work out the cash requirements using this model.  For example, if your business wishes to grow its sales from £500,000 to £750,000, the working capital requirement will grow from £100,000 to £150,000, or by (£750,000 – £500,000) x 20% = £50,000.

Besides the working capital, funding growth may require investment in fixed assets, e.g. new equipment, new premises, etc.  Cash required for this capital investment needs to be added to the working capital requirement to determine how much additional cash the business needs to achieve a set level of growth.   In our example, let’s assume the new level of growth can be achieved if we invest £75,000 in new machinery.   The cash requirement for the first year becomes:

Working capital requirement                      £50,000

Capital investment (fixed assets)               £75,000

Total Cash Requirement                              £125,000


Where will I get it?

There are two main sources of funding – shareholders / owners and debt.  If the additional sales (£250,000 in the example below) bring in profit (let’s say at 30%), this could be used as part of the funding.  In our example, 30% margin would give £75,000 in profit, which leaves £125,000 – £75,000 = £50,000 to be found via a loan.

If, however, the business is generating a loss, there may not be enough cash left in the business to reinvest in growth, leaving a much higher proportion of growth to be funded by loans.  Banks, or other sources of debt finance, may view a high proportion of loan funding as too risky, which essentially leaves the business without the necessary cash to fund the desired growth levels.

But do not despair: there are numerous ways to improving your working capital – including (among many others) reducing the debtor days, just-In-time stock management, different pricing strategies and internal efficiencies – which will allow you to fund growth internally.  Whatever the scenario, staging your growth in such a way that you can grow safely is paramount to your business survival and success.

Strategic clarity on the back of an envelope

A few days ago, I met a friend of mine over a coffee.  When I commented on the deep ‘worry’ lines on her forehead, she shook her head and said, “I just don’t know what to focus on.  I have this long list of priorities – and no time to give to all of them, so every day I scrape the surface.  My staff all have different opinions about what our priorities should be.  And the complicated thing is that they are all correct:  the things they bring up ARE priorities.  But I am so overwhelmed, I feel I will never get to the top of the pile.”


After some more coffee and a medicinal chocolate muffin, I had brought out the oldest tool of all – the back of a large envelope which was lurking at the bottom of my bag (did you know many great ideas started that way?  Southwest Airlines in the US were conceived on a café napkin).  I had asked my friend what her ultimate business goal was.  I then asked her to identify the key drivers that would make that goal improve.  The key was to establish a clear cause-and-effect relationship.  As my friend was a senior manager at a higher education institution, our initial drawing looked like this:

Pic1


Luckily, in higher education there is a measure for everything, so it was quite easy to establish both the current position and the desired position for each of the outcomes.  What this showed was the gap – and hence the distance required to travel in order to get to the desired position.  In my friend’s case, the quality of research was very good, but both student satisfaction and student employability were poor.  This gave a clear focus for where time should be invested.  But how could these outcomes be improved?


What we did next was to break the initial drivers even further, to understand what had the most direct impact on the outcomes shown in green.  Taking one of these as an example, here’s what we drew next:

Pic2


As in the previous step, the gap between the measures of the current vs desired position had shown where the effort had to be directed.  Before we saw the bottom of our coffee cups, my friend had e-mailed her staff requesting that they establish consistent visiting hours for students and respond to student e-mails the same day.


This exercise is brilliant in that it can bring clarity to what is otherwise a chaotic to-do list.  It can also help to formulate strategy for improved outcomes in business development, problem solving, etc.  Unfortunately I cannot take credit for it – this is a well-known technique used in outcome mapping (originally designed by the International Development Research Centre), and is similar to the Product Breakdown Structure (PBS) in project management.


Do this with your management team, or even with your staff (if you are brave), so they own the output and understand the causal relationships – and get someone who is a good facilitator to help you.